user experience /
Experian
insights
the problem
When working for Experian I was tasked to create a data tool that provided real-time reports that allowed customers to create their own unique dashboards and reports based on the users needs and requirements.
This was a product that sat with our flagship product – Experian One.
As Experian One was still in it’s infancy it didn’t really have much structure in terms of where new products would be placed how how they could accessed, so I looked into the navigation and positioning of where and how users would access the new Insights product along with any other products that could be added in the future.
As for the product at the start of this project, the reports were hidden away in a tree structure of a list, this was ok to a point, but the fact the process was very slow, clunky and hard to navigate, open and click between other reports made it almost imposible to just freely view multiple reports quickly and with ease.
My role
User research // Affinity mapping // Competitor analysis // User flows // Tree jack // Wireframes // Visual design // Prototyping
Strategy management (as is)
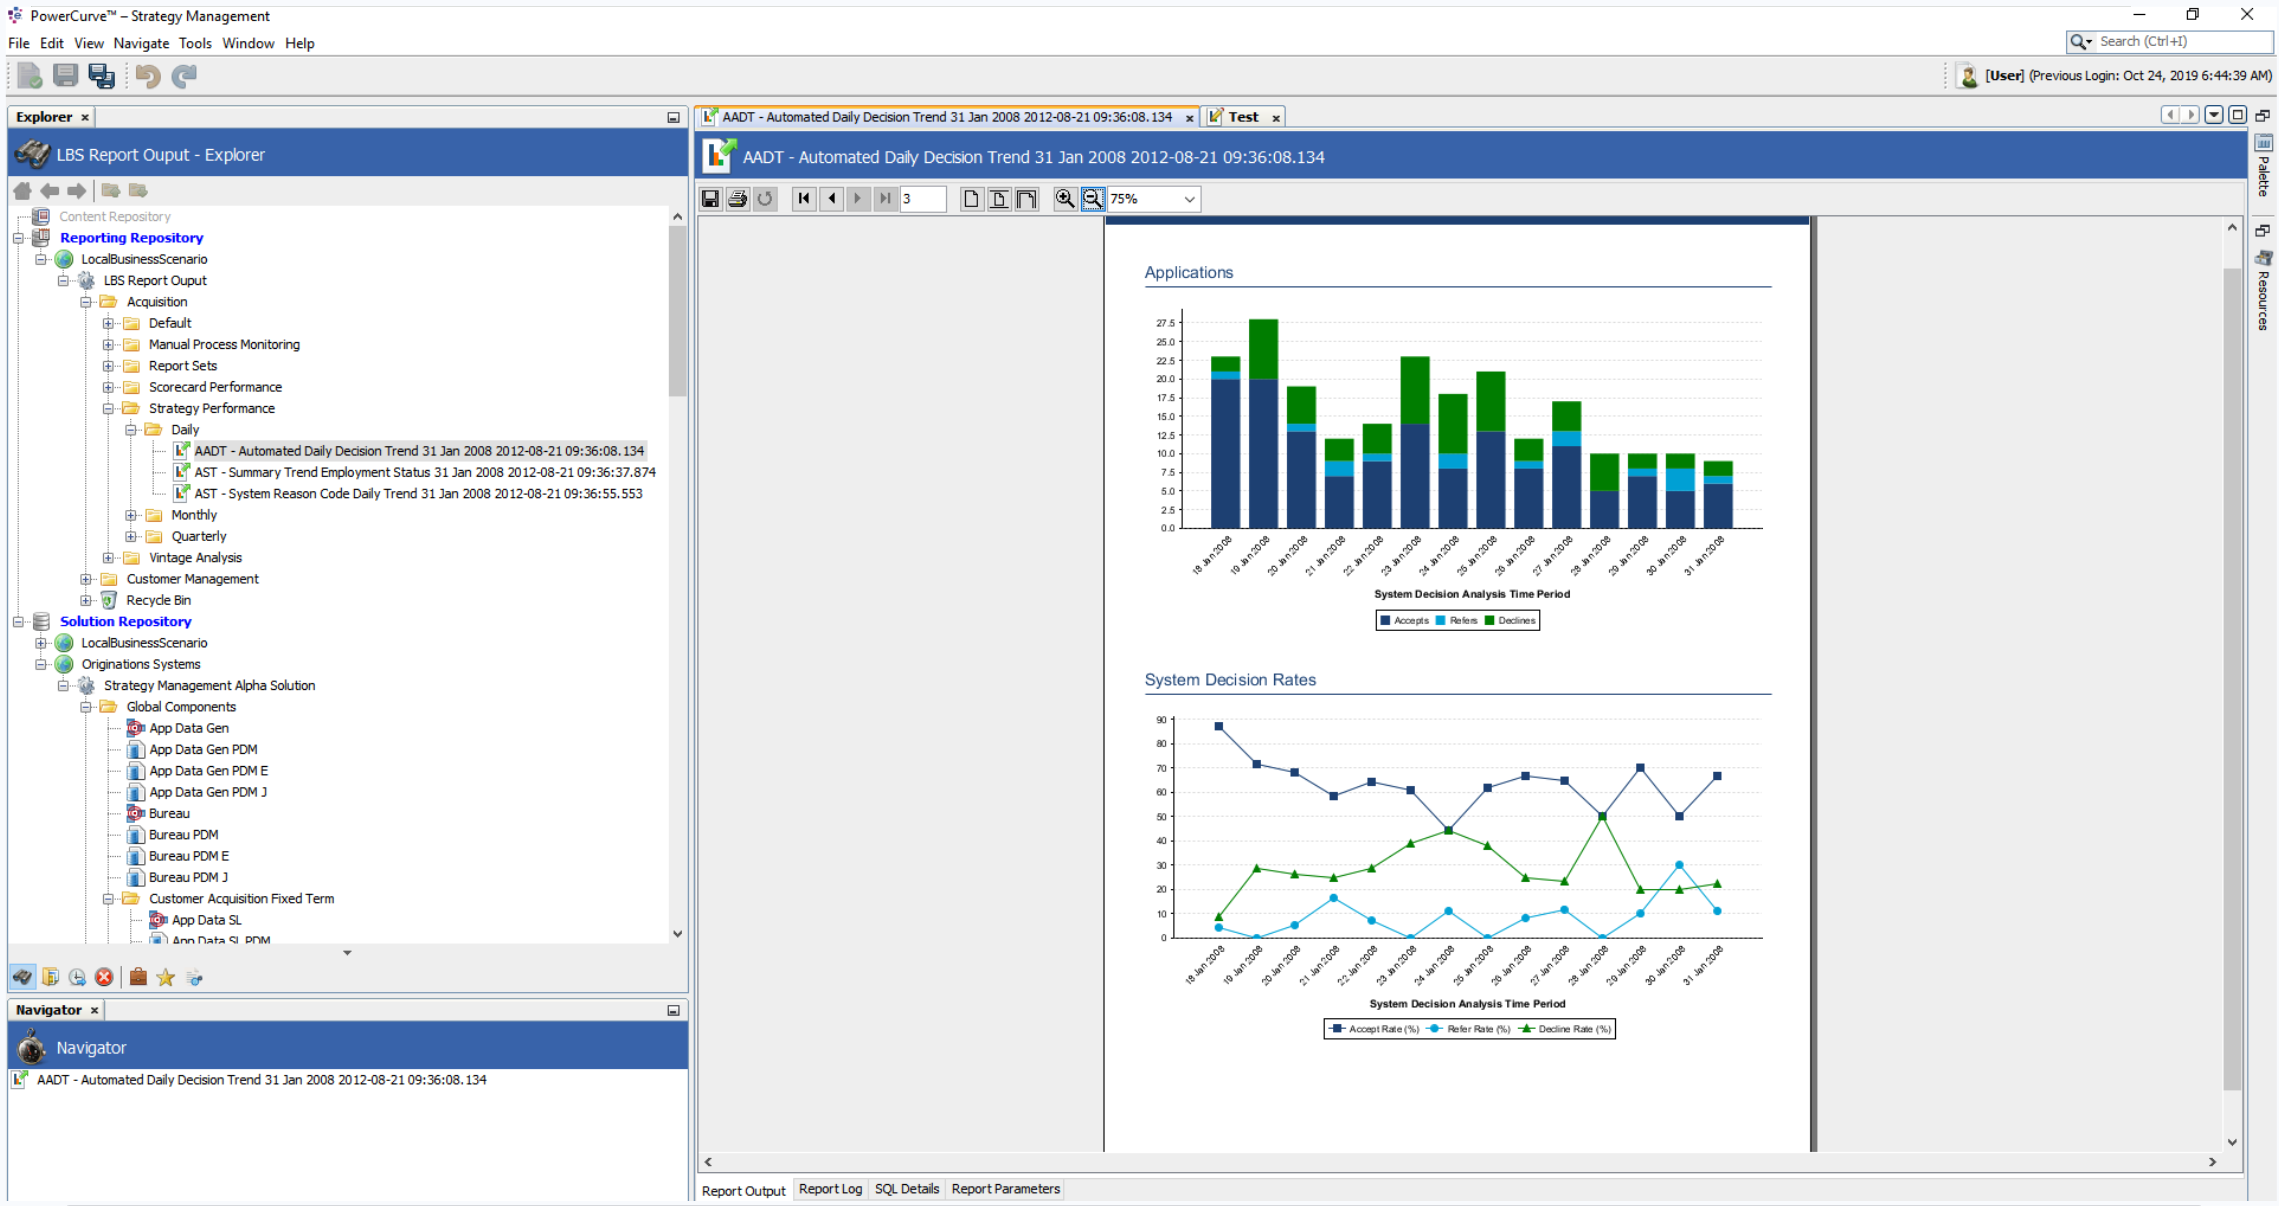
So we had two views, a sort of navigation view where you looked for your reports that were (kind of categorised).
When you had finished navigating through the folder structure and clicked on the report of your choice, it would appear in the view window.
These were PDF like and not interactive whatsoever, just static images with different charts on the screens.
THE USERS
Currently, Insights (or “BI Reporting” as it was first called), was aimed specifically for strategy designers, analysts and data scientists.
This allowed users to monitor strategy performance across the businesses and compare strategy outcomes against any benchmark data to look at and act upon.
As this was a brand new product, it could potentially have multiple links and additional categories, this could quickly fill up the Experian One dashboard so one of the first tasks was to focus on the navigation to access Insights.
Option one: As the link to the application was going to be nested in the Experian One dashboard, do we create a specific section on the dashboard for all reports and categories to be housed?
Option two: Or do we allow additional paging so once the application has been clicked users can dive down and navigate into a specific Insights (BI Reporting) page?
I decided to go with option one as I found out that the folder structures that would be required could be appropriately created in the application itself so that means we can keep the Experian One dashboard as simple and streamline as possible.
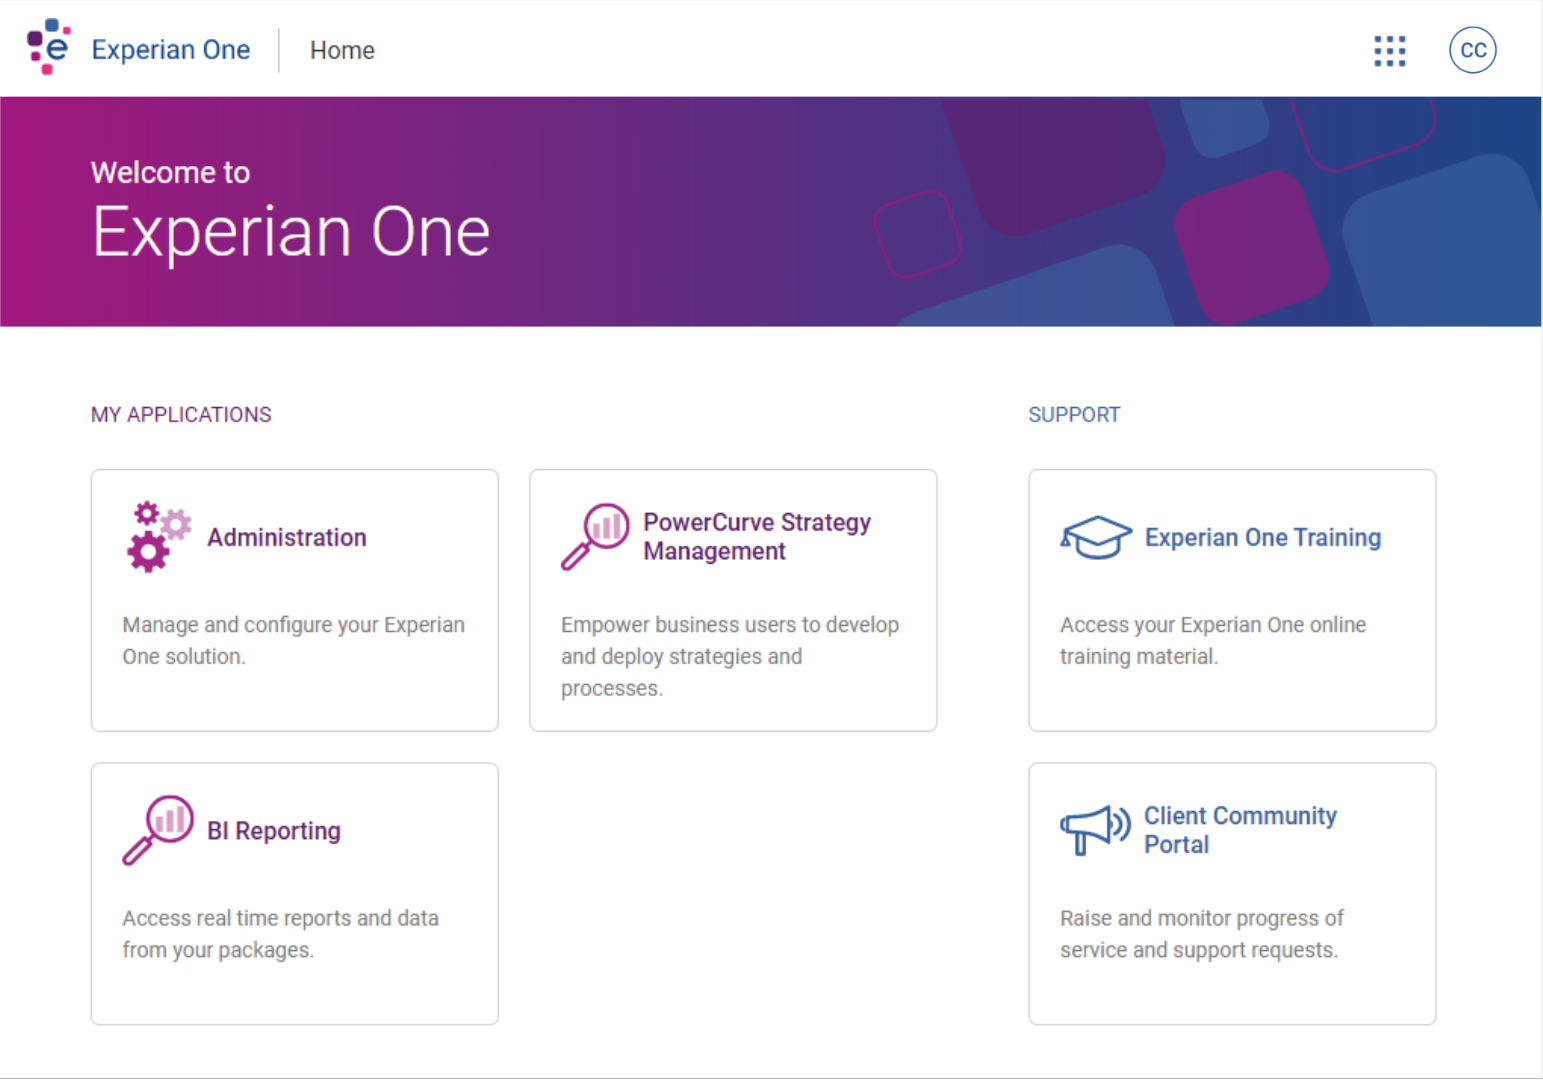
Option one – users click ‘BI Reporting’ and the application opens
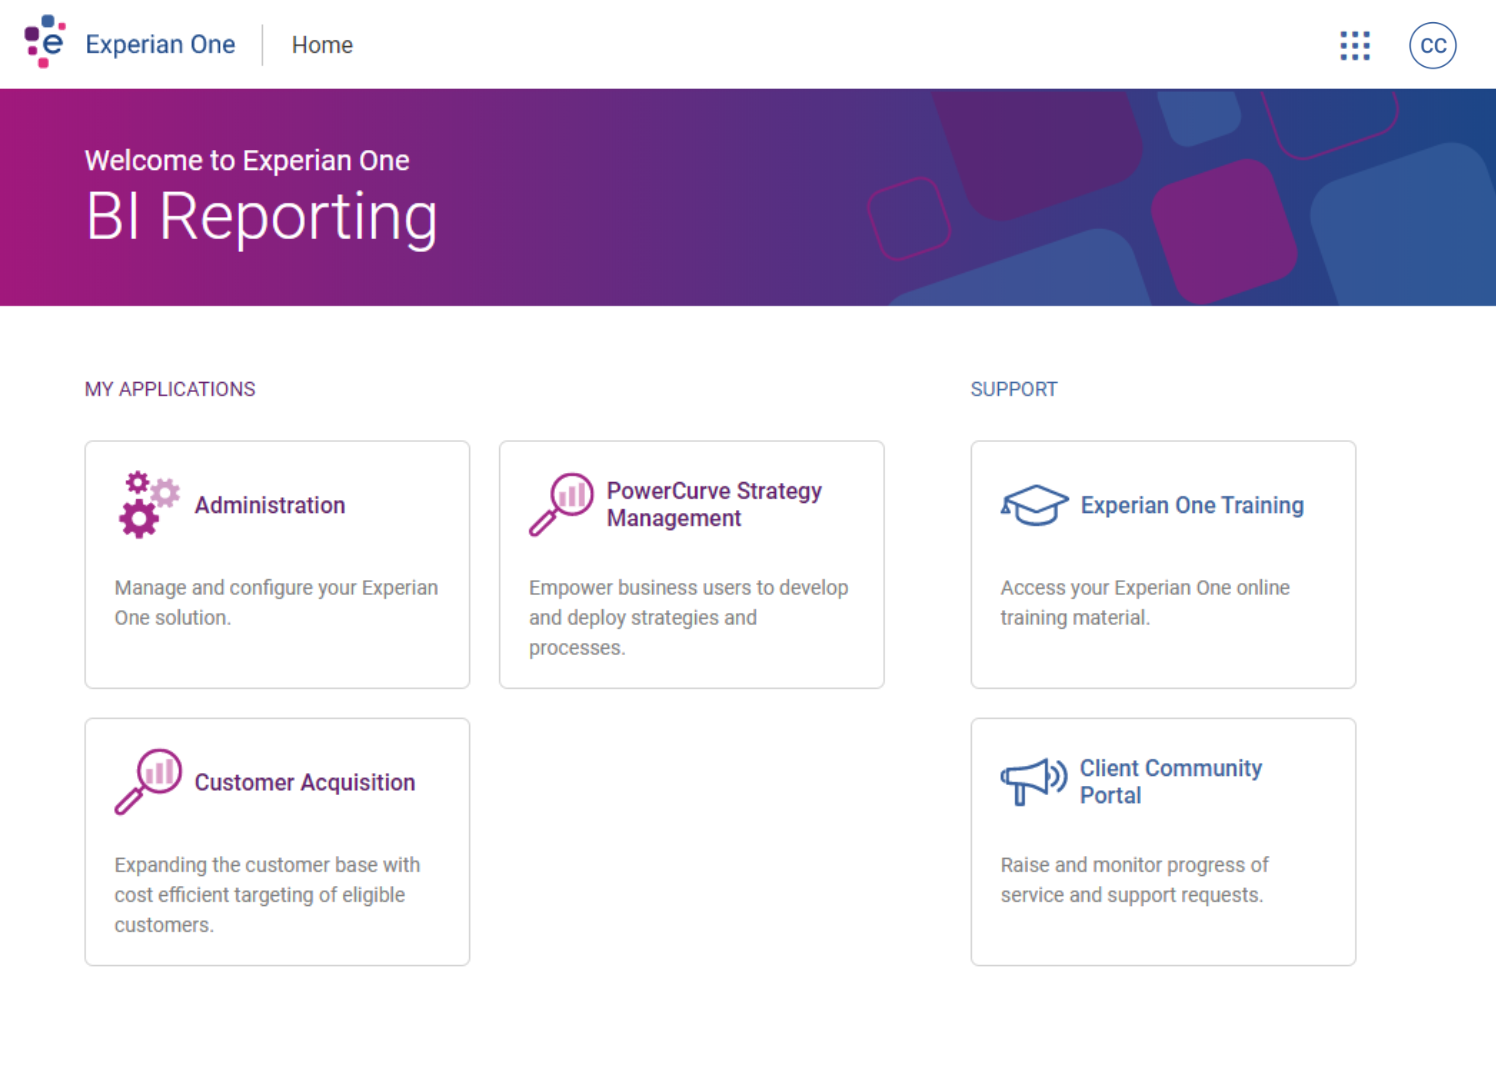
Option two – users click ‘BI Reporting’ on the Experian One dashboard page and get navigated to a specific BI Reporting page
Ideation Process
It became clear that I needed to work on a more lean navigation flow that removed the frustration of navigating through folders to find there were no reports at the end of the journey.
USER JOURNEY FLOWS
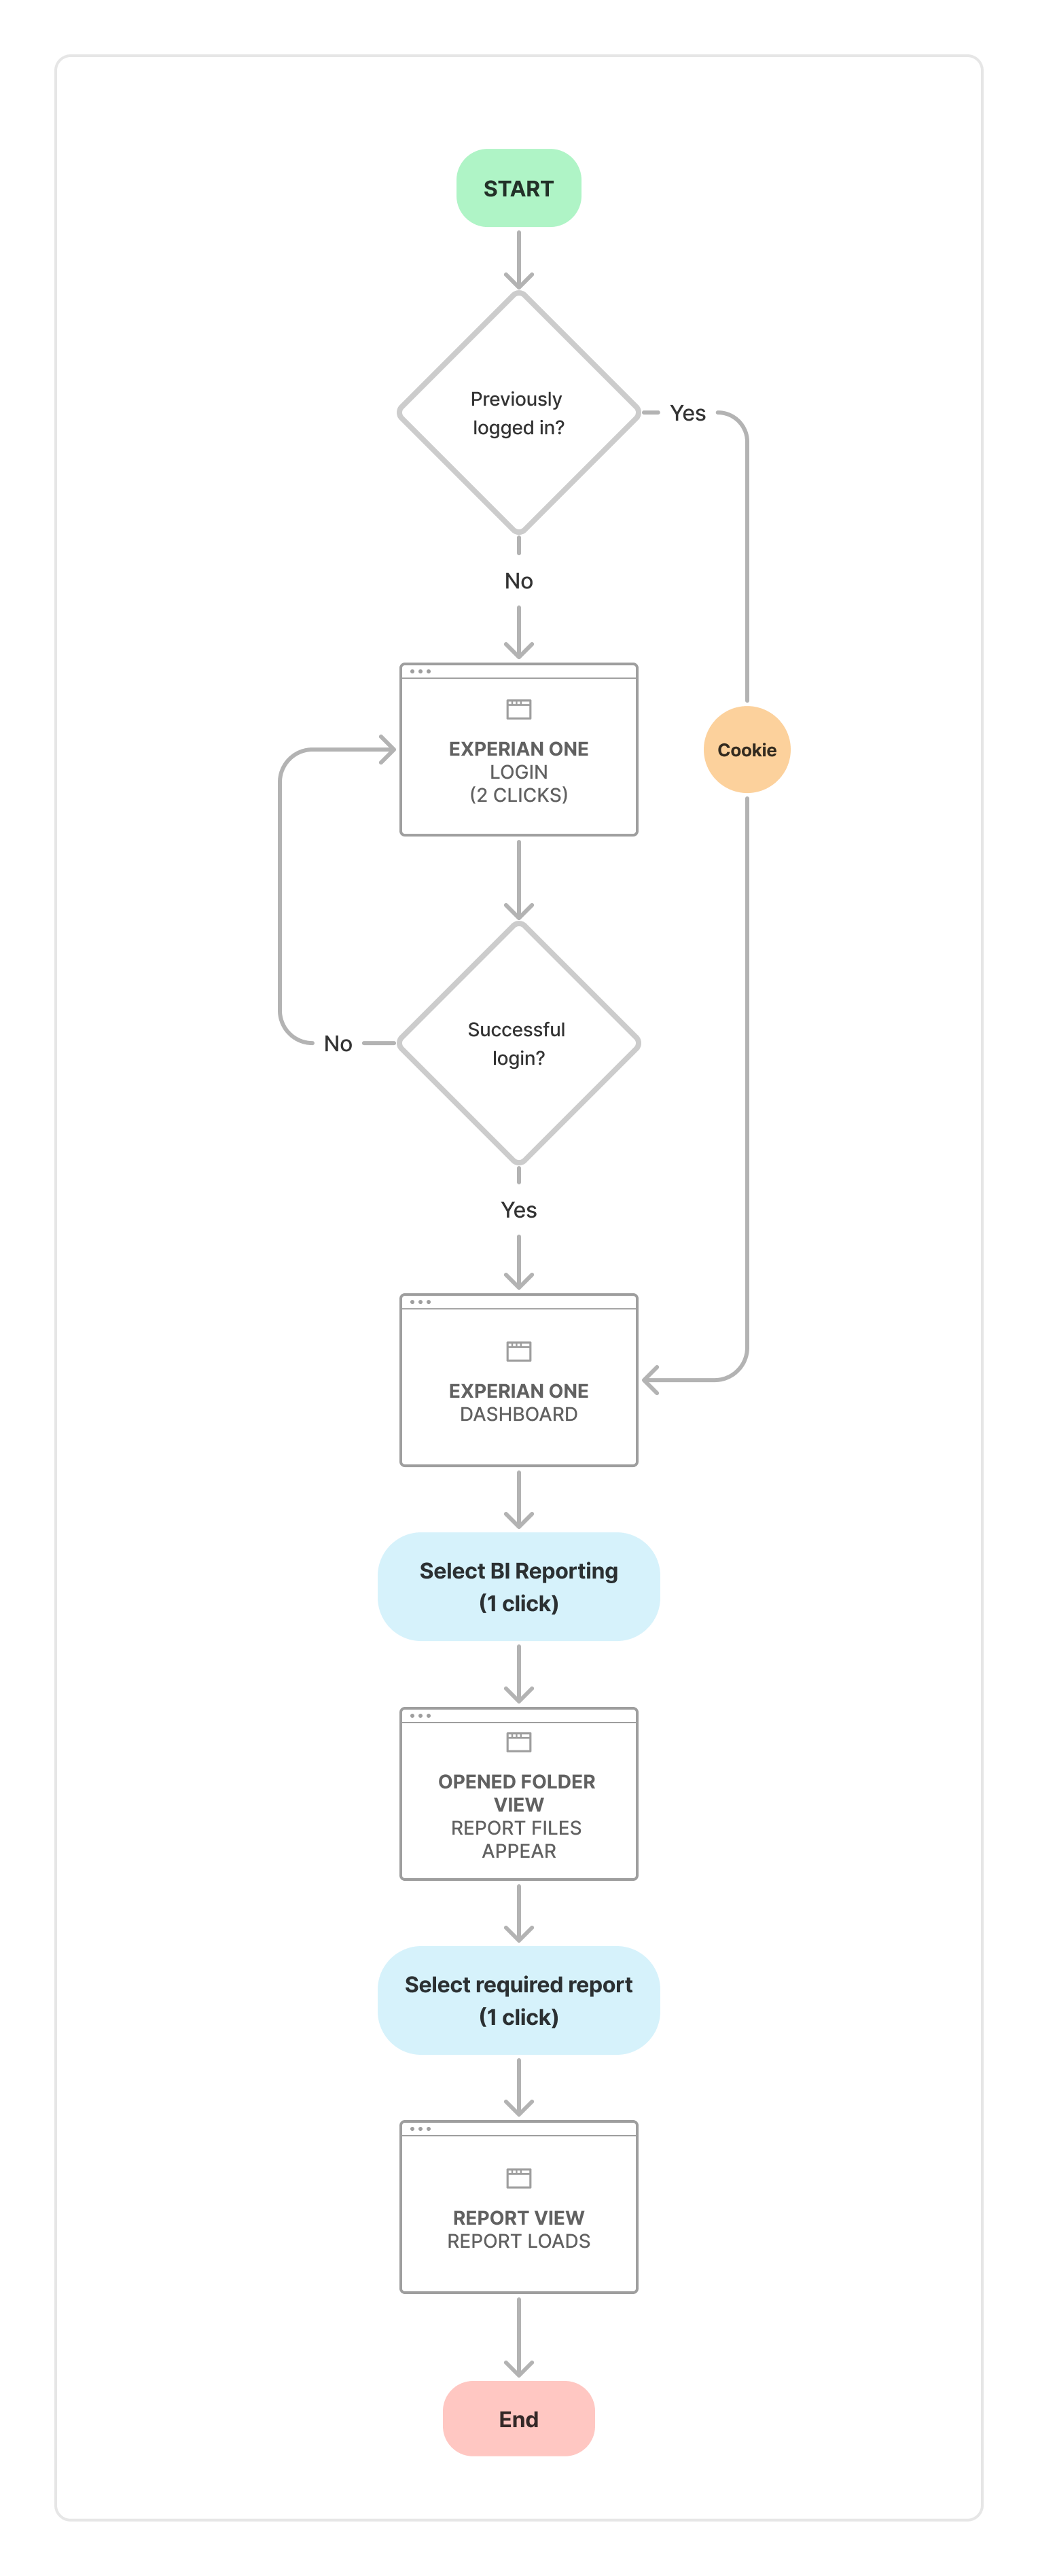
Taking everything into consideration, I mocked up a couple of user flows. One that showed the current journey that a user would take to open up a single report – For security reasons this included logging into the Experian One product which automatically added 2 clicks to the flow (minimum).
CURRENT REPORT FLOW
To access BI Reporting, users will need to sign into Experian One if it is the first time in doing this, if not a cookie is stored to prevent users having to sign in everytime.
Once logged in, you land on the Experian One dashboard where you can view other applications that you might have on your dashboard. The user can select BI Reporting (Insights) here.
The application then loads and you are greeted with a view of all the folders (servers) and reports that you can access.
One of the main issues currently with this flow is that it isn’t obvious which folders have reports in, so you might click on a folder, the page loads, and you are greeted with a “This folder is empty” message, which means you need to navigate your way back to basically start over again.
Once you’ve actually managed to find a report, instead of finding empty folders, you can click into the report to open the file up.
Once you have finished looking at that report, you can close it down and go back to try and find another file which has reports you can access.
Current process total clicks: 6-8+

SUGGESTED FLOW
So like the current flow, users still need to go through the Experian One login flow, unless they have already done this in the past.
Once logged in, you land on the Experian One dashboard where you can view other applications that you might have on your dashboard. The user can select BI Reporting (Insights) here.
The application then loads and you are greeted with a homepage of sections that are the folder titles with the reports that would normally be hidden away in the folders – I thought it would be best to take the approach of instead of hiding reports in folders, don’t have the folders at all!
Doing this removed the frustration of having to constantly click into folders onto to find out that no reports are available to view! This approach probably would be so bad if the navigation to get back was better, but it is so bad, users ended up just closing the window down and starting again.
New process total clicks: 4
While the difference from 6 to 4 clicks isn’t massively different in the grand scheme of things, I believe I have come up with a solution that makes the overall navigation between reports and folders much more simpler to use and navigate.
Dashboard Wireframes – v1.0
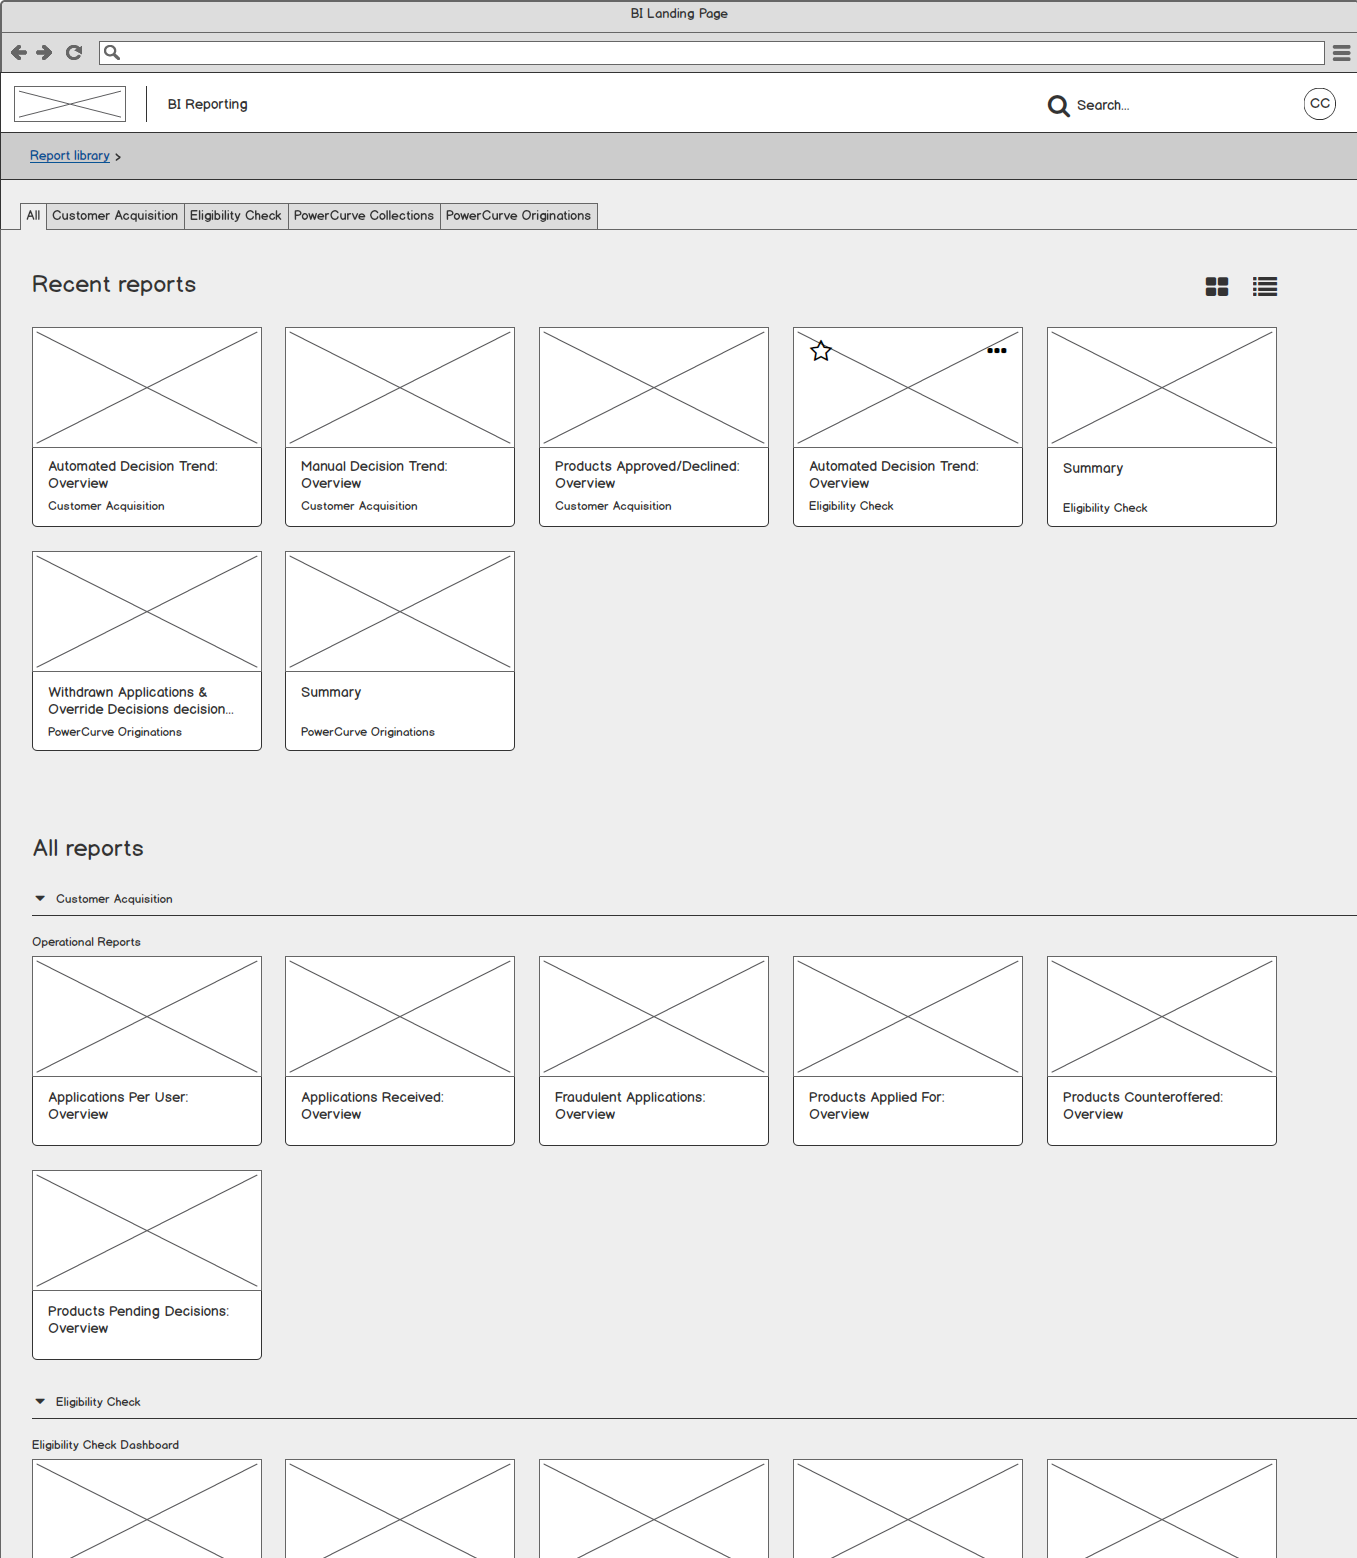
Currently the reports were hidden away in a sort of tree structure of a list, this was ok, but the fact the process was very slow and clunky to navigate made it almost imposible to use with ease.
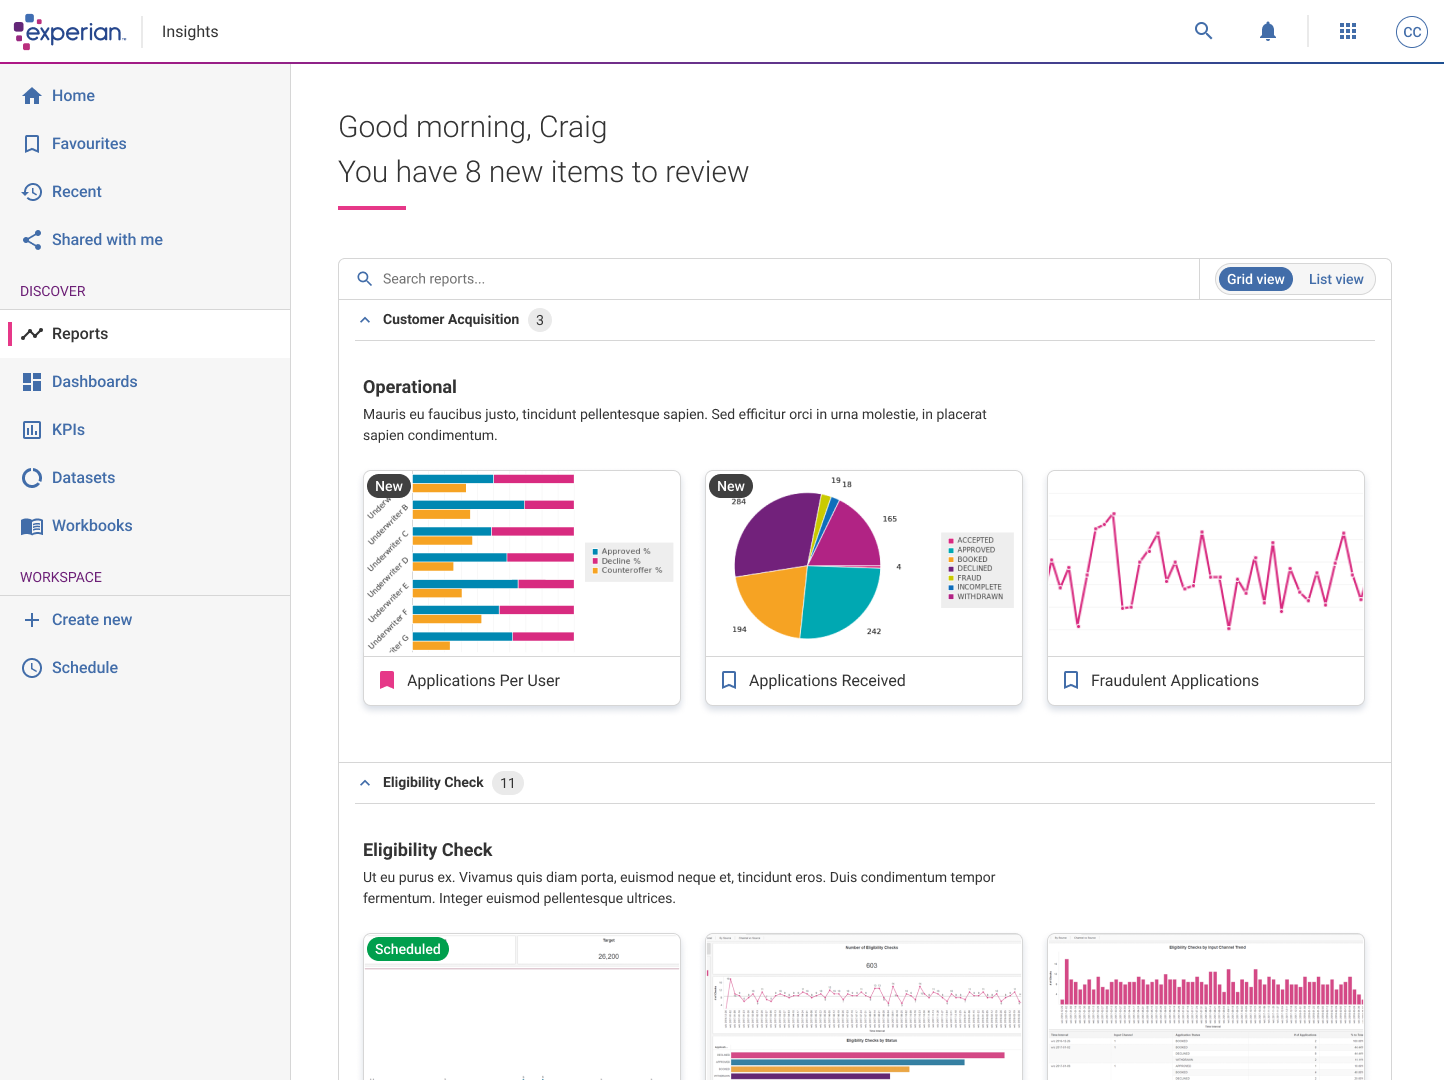
For phase one, instead of working on the tree navigation, I thought it would be good to put all the reports in an opened ‘accordion’ like component. This way it was clear to see from the beginning which ‘folders’ had reports in them.
I also added a tab at the top of the page to easily allowed users to filter down to a specific section easily.
Open report Wireframes – v1.0
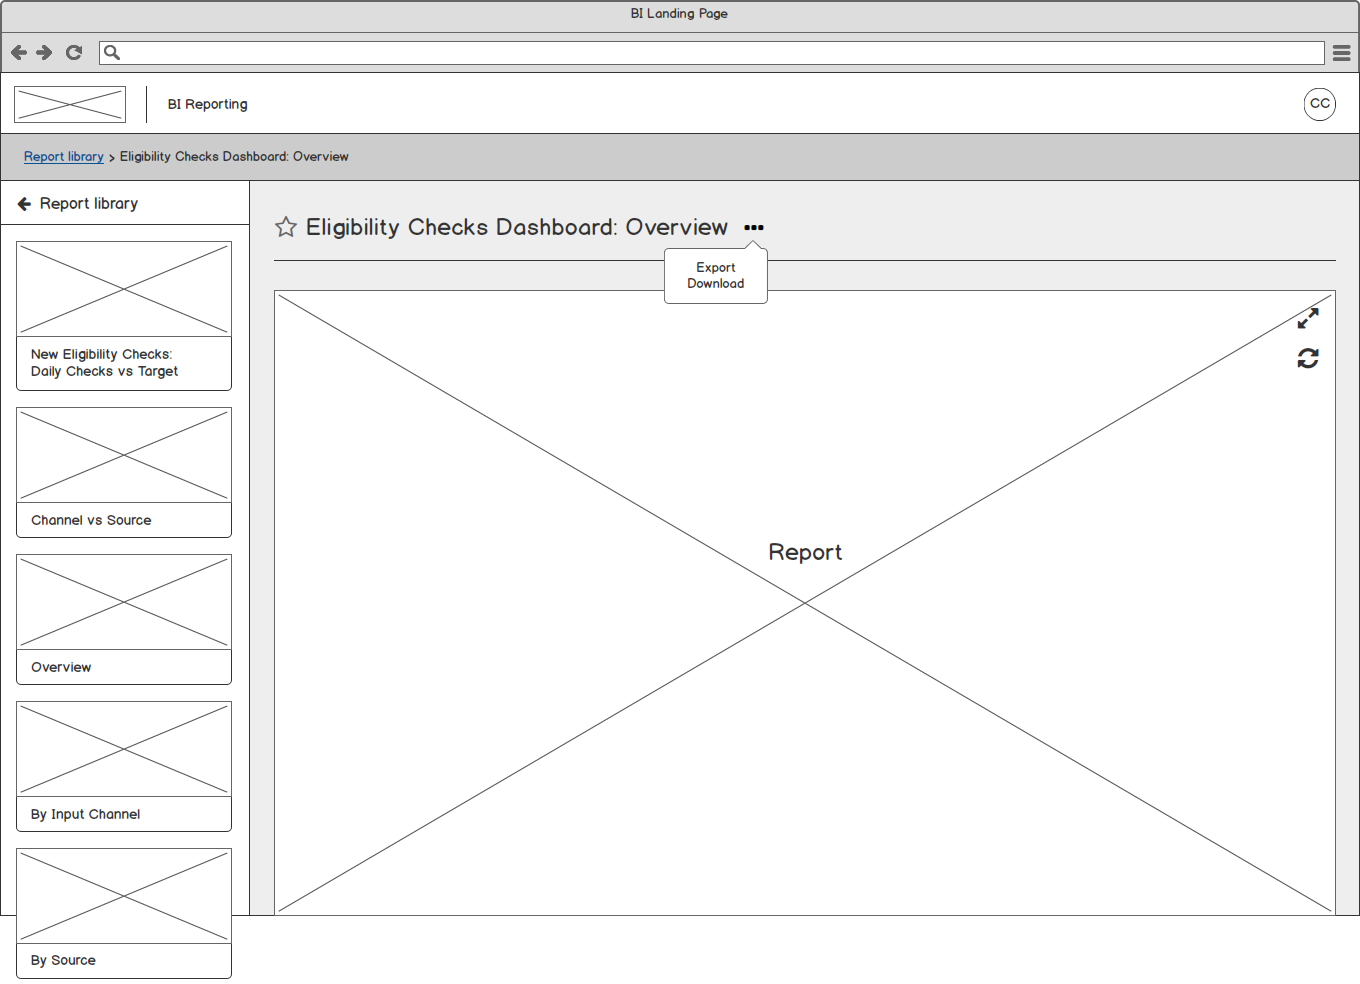
Currently the reports were hidden away in a sort of tree structure of a list, this was ok, but the fact the process was very slow and clunky to navigate made it almost imposible to use with ease.
For phase one, instead of working on the tree navigation, I thought it would be good to put all the reports in an opened ‘accordion’ like component. This way it was clear to see from the beginning which ‘folders’ had reports in them.
I also added a tab at the top of the page to easily allowed users to filter down to a specific section easily.
Tree jack task
After this first pass of wireframes, a decision was made to start allowing users to create new dashboards, reporting schedules and integrate KPIs, Tasks and the ability to favourite reports, as well as a host of other jobs.
As a result of this, it meant that I needed to add a navigation bar into the designs.
opinionated design
The product lead emailed me asking if it was possible to add a couple more links into the navigation design, at the time I didn’t think to much of it and agreed to consider adding his suggestions.
Once I’d actually recieved all the links along with a rough sketch of the structure he wanted the navigation to look like, it quickly became obvious that the navigation needed to be streamlined!
I got given a long list of links, which some had double and even triple layers deep and could be infinite links deep as users could add as many reports / tasks / workbooks and datasets as they like. This was obviously not the correct way to structure a navigation.
As a result, I decided to create a tree jack. This is where you provide users with data (in this case, the links for the navigation), and let the users structure and order the links however they wish. Doing this will give an overview of any potential common patterns that need to be considered in the design stages.
The results
I already had in my head a streamlined, easier way that users could navigate and use the navigation bar, but I still wanted to see if the users I tested thought the same about what the product lead was proposing.
The results were mainly confusion, and highlighting how many links there are to pick from. One user even highlighted that they had 50+ report folders and some have over 100+ reports to select.
If that instance got put into the structure that I was testing out it would obviously break.

Navigation Design
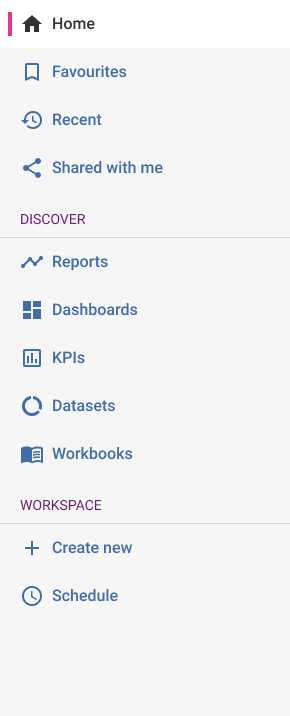
I took all the feedback onboard and decided to structure the navigation into three sections, one to house all the ‘Viewing’ tasks, one to house all the ‘Creation’ tasks and another for any of the little tasks that didn’t fall into either section.
THE OUTCOME
So my initial thoughts after looking at all the links in the tree jack, it became aparant that there were two sections, one for viewing and looking at things, and one for creating and scheduling.
I went with ‘Discover’ and ‘Workspace’. If you click on the Reports link, it would take you to your own created Report library page (as shown in the previous wireframes). This would be the same for viewing dashboards and KPIs for example.
For the Workspace section, you had the ability to create all of the items under the Discover section. Initally I had them flipped so Workspace was sitting at the top, but users primary usecase was to view and look over things over creating things.
Landing page
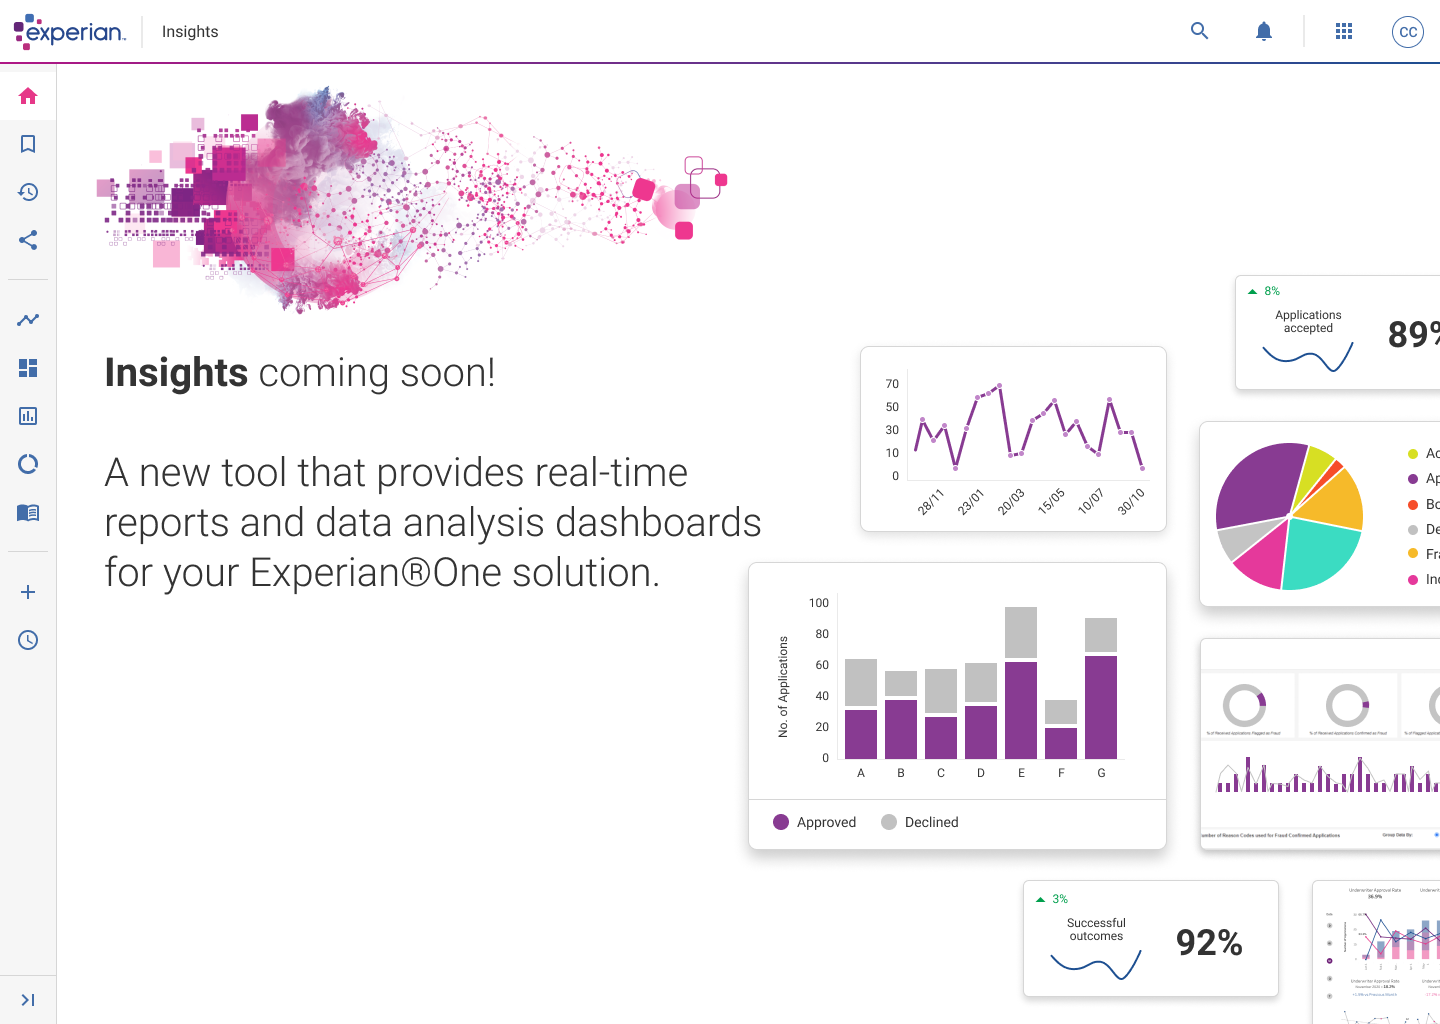
The product started to gain some traction thoughout the business, people started getting excited about the product so the next task was to give BI Reporting a ‘catchy’ name, along with a landing page for people to navigate to after logging in.
The final decision was to call it Insights.
Easier to navigate than the old platform
Intuitive and easy to set up and create new reports
Ability to save and favourite reports
Report library
Experian started using Tableau for their reports, this was a positivie step as it made all the reports more interactive and less static like they were previously – you could hover over specific data and get an exact figure.
USER TESTING
After the design was signed off, I prototyed up the screens so that users could navigate through the visuals as if it was an actual application.
Doing this helped to make the product feel real, you can get good feedback whilst users and navigating through the screens.
We asked the users a selection of questions, and we asked for their opinions on specific areas of the interface, as well as what they liked about the interface and if they had the ‘power’, what would they change if they could.
THINGS TO CONSIDER
Add some sort of filtering and sorting, searching specific dates, types of customers and daily date ranges.
The ability to remove any reports from the dashboard that have been created. Currently they are created by admin staff and they can remove the reports for the users.
A couple of people asked how reports would be added and created so they appeared in the Report library page – need to consider some form of personalisation instead of relying on Admin / Superusers to define everything.
“Very easy to navigate and follow – anybody can use this”
“It’s a lot easier to navigate and I like the thumbnails – they make the reports very easy to identify”
“I like the layout of the reports and you can use the tabs, the graphical thumbnail. The engagement and UX has clearly been considered”
“Much easier to use, well designed and intuitive – would give some of the other BI tools a run for their money!”
“Easy to use and understand. Layout is nicely designed, not complicated and easy to follow without by being
trained”
report viewer
We used Tableau for our reports, this was a positivie step as it make all the reports more interactive and less static like they were previously.
NAVIGATION STRUCTURE
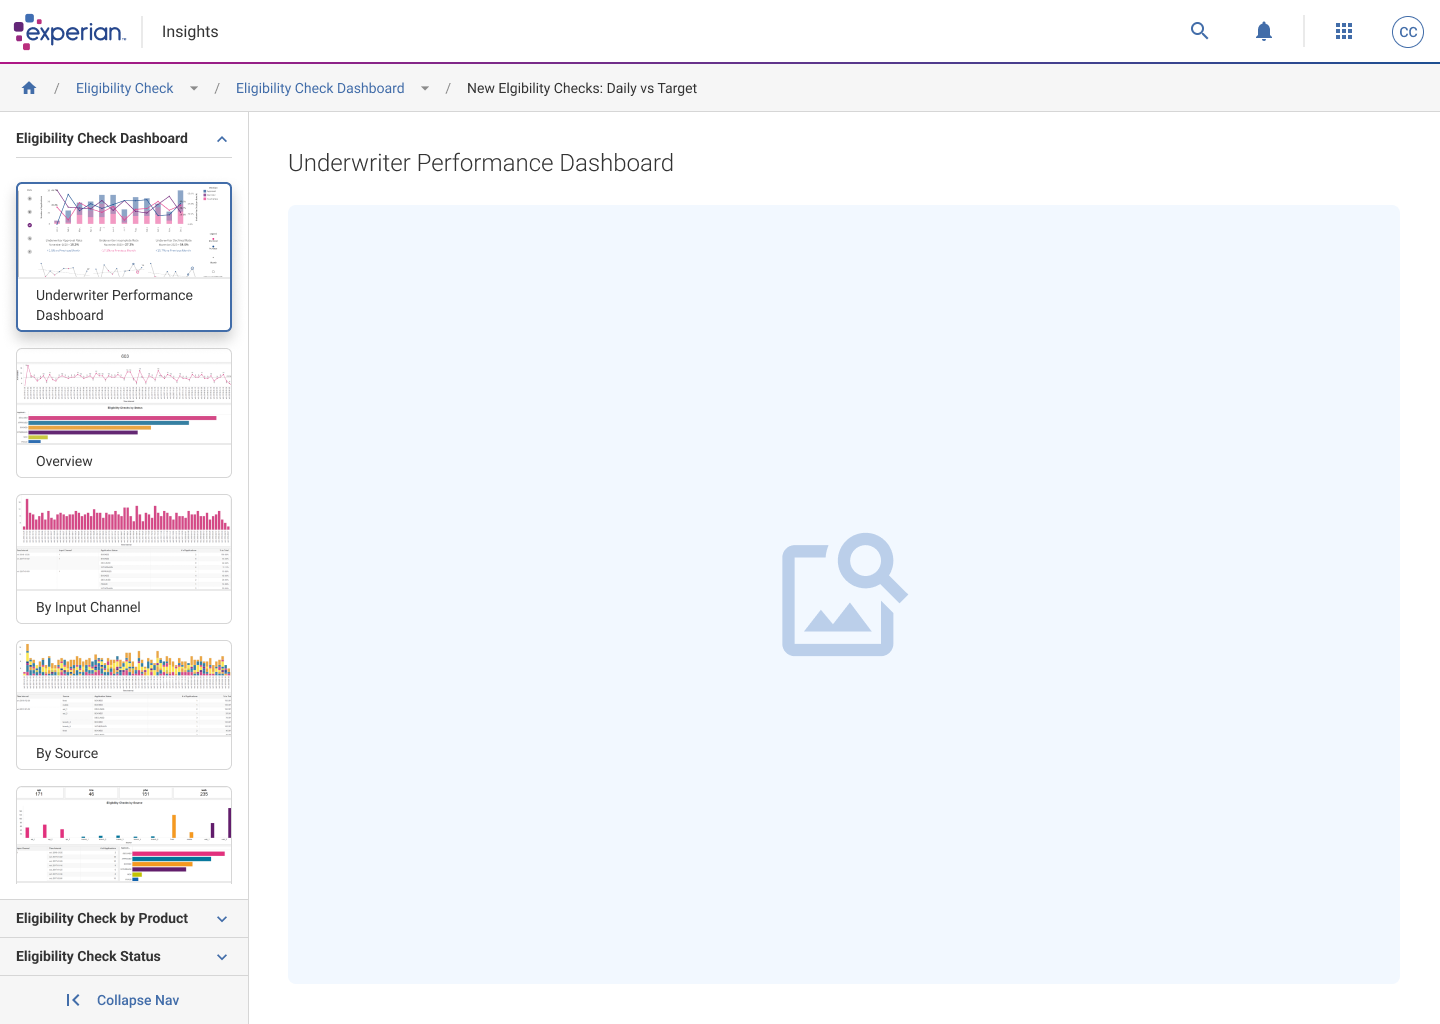
To help save the loading time and constantly having to click back and forth between a report, the Report library and back into another report again, I added the ability to navigate with ease between the different areas by designing a scrollable left panel that housed the different reports in their folders.
When clicking the accordion, it would open and show the reports available in that section.
When a report was selected, it would appear in the main area, so you can view, and quickly view another report straight away in one or two clicks.
THINGS TO CONSIDER
Add the ability to add different permission based profiles such as Superuser, Can edit, View-only.
Create a sort of community area where members can comment on, share between other members and create some form of schedulling within the report view.
Phase 2 – ‘Create’ area
At the beginning of this journey I started putting together ideas that allowed users to create their own dashboards and reports.
SELECTION
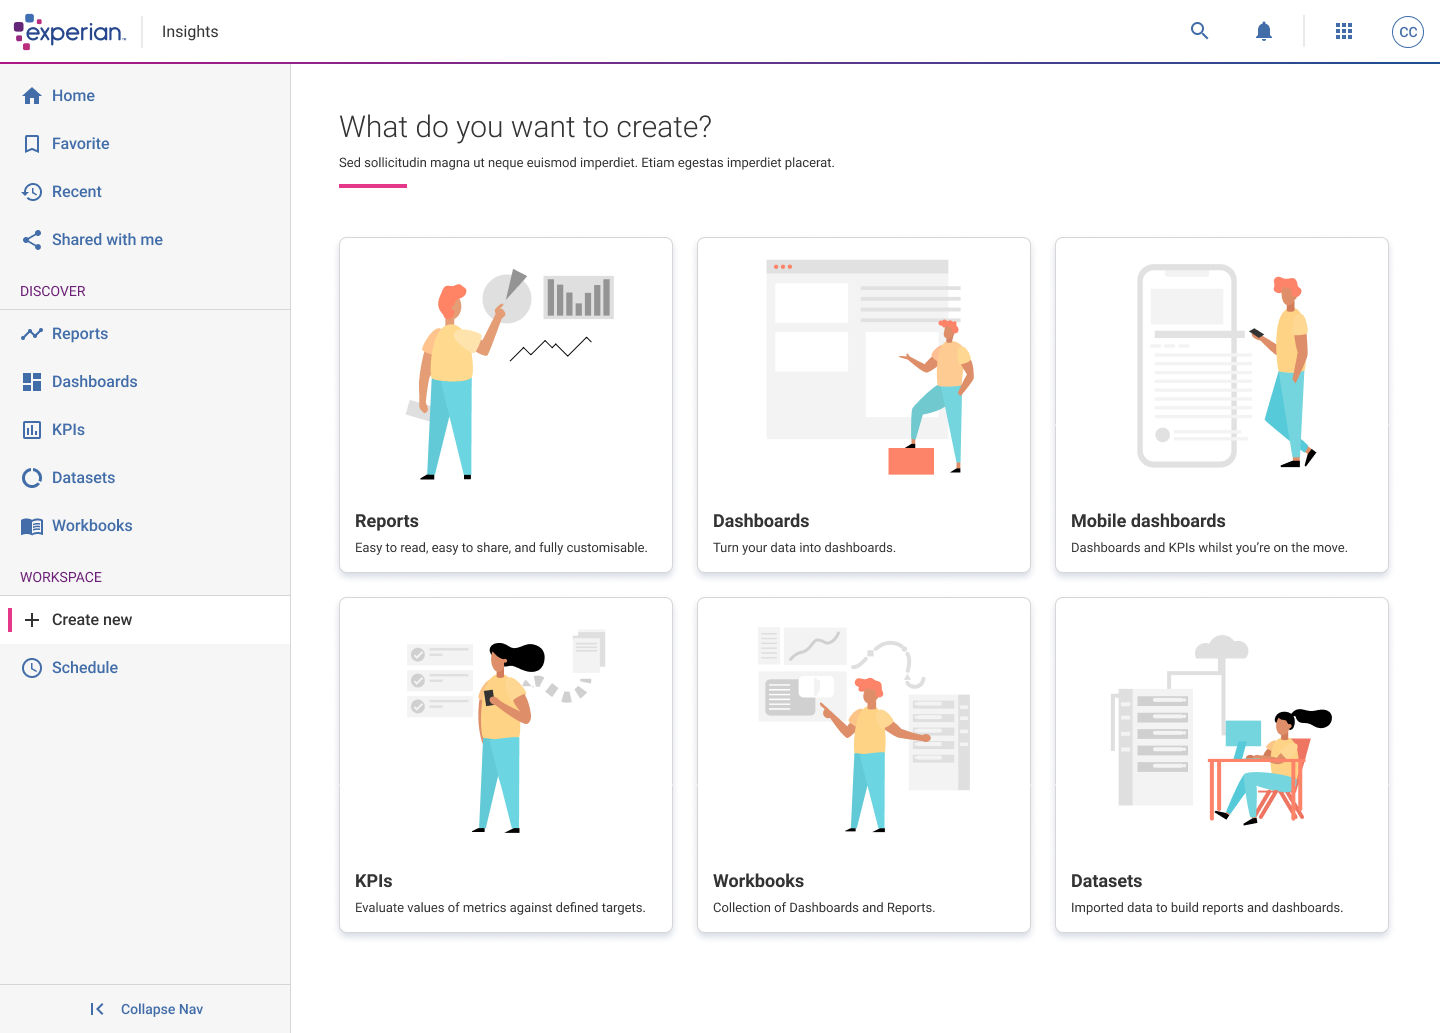
Users land on this page and have a choice of creating Reports, Dashboards, Mobile dashboards, KPIs, Workbooks and Datasets.
Selecting Reports and Dashboards would open up Tableau, everything else was create through the Experian applications.
dashboards
Dashboards are a selection of grouped Reports that users have put together, doing this lets users to see a selection of live reports without the need to navigate back and forth.
SELECT YOUR LAYOUT
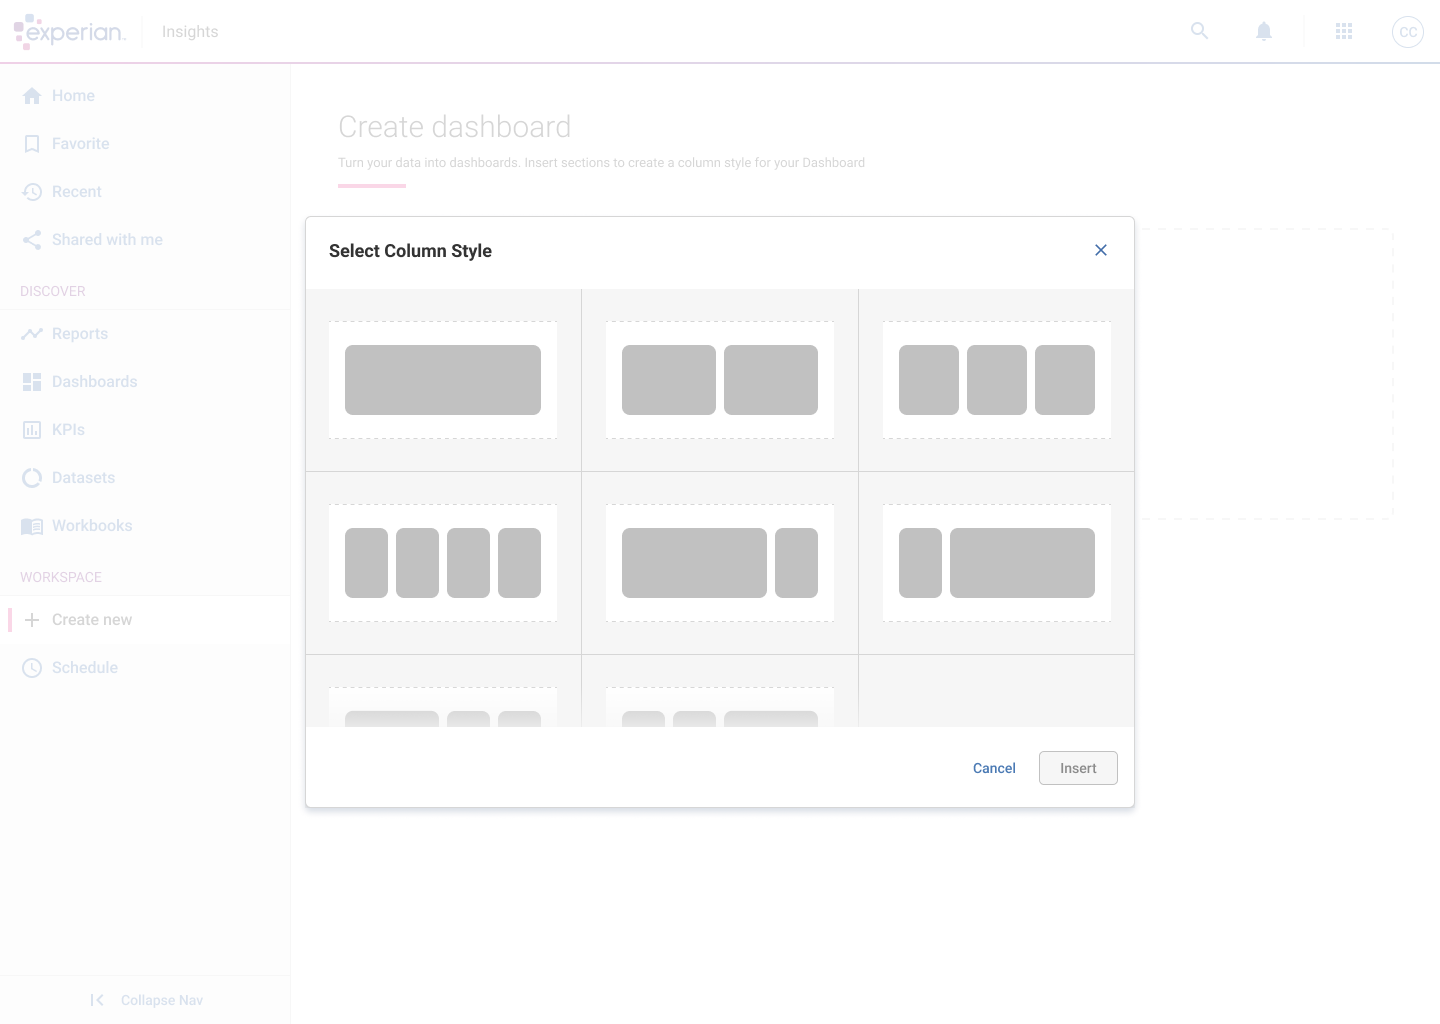
Once selecting ‘Dashboards’ from the Create page, users have the ability to select the layout they want their dashboards to look like.
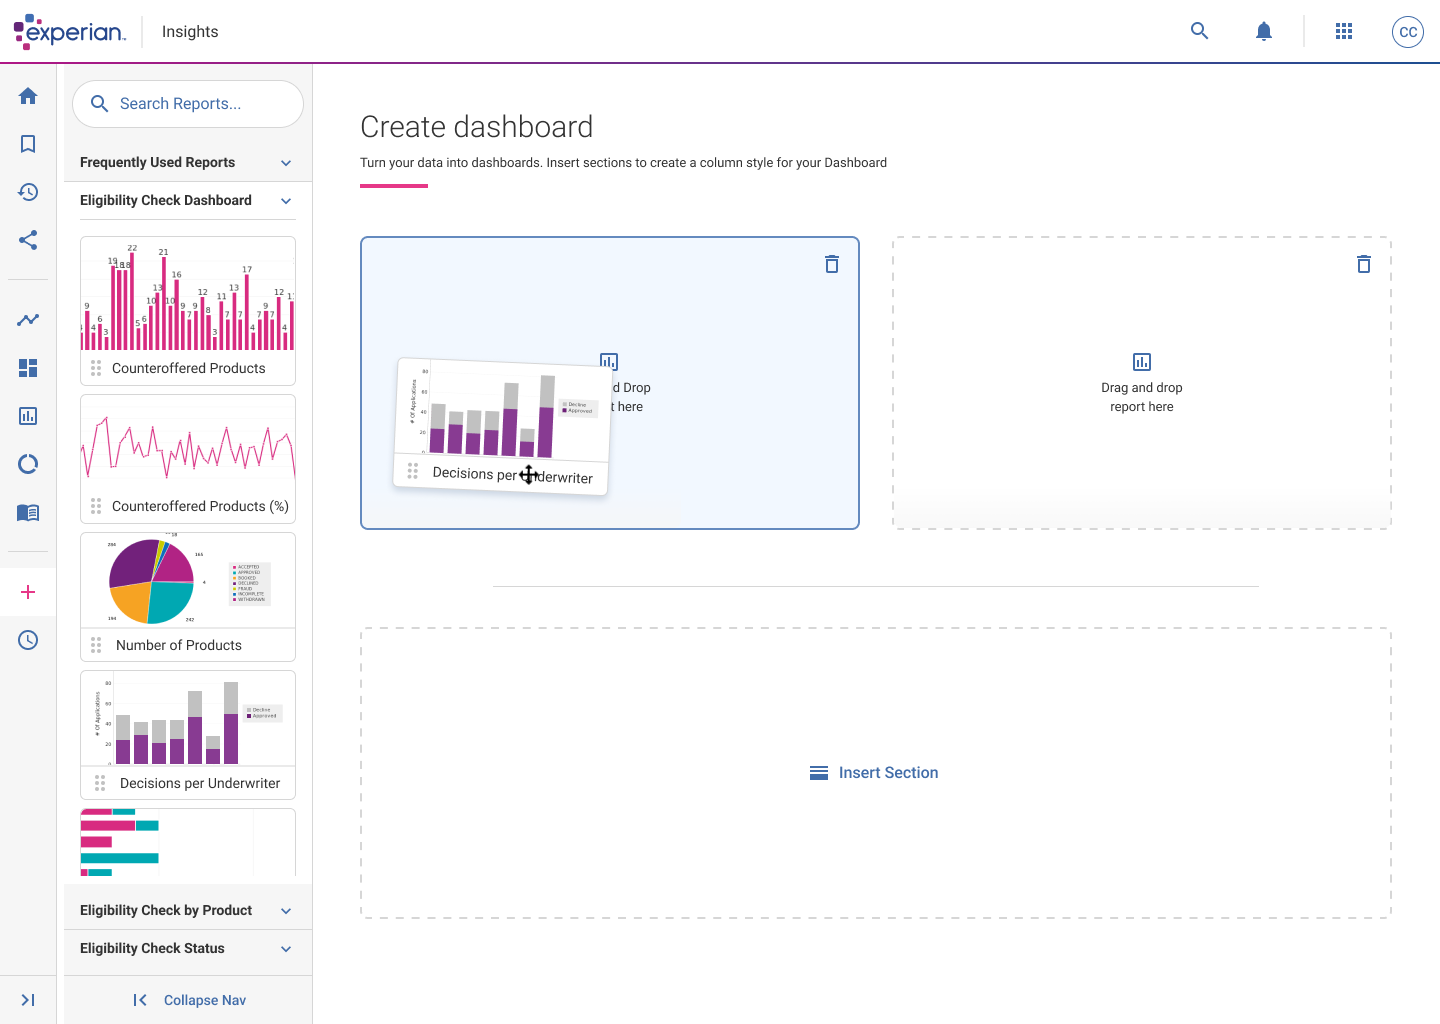
Users then select what reports they want to go where by selecting manually or dragging and dropping the report thumbnails into their relevant spaces / order they need.
DRAG & DROP
Users can search for any report available and literally drag and drop the thumbnail into a space and the report appears in that gap.
Users can also click into the space to search for a report on their device.
If another section is needed, click on the ‘Insert Section’ area and the ‘Select Column Style’ modal will appear again.
Mobile dashboards
I created a selection of user journey flows to test out how users could create mobile dashboards easily and view the KPIs on their mobile devices whilst on the move.
DYNAMIC DESIGN
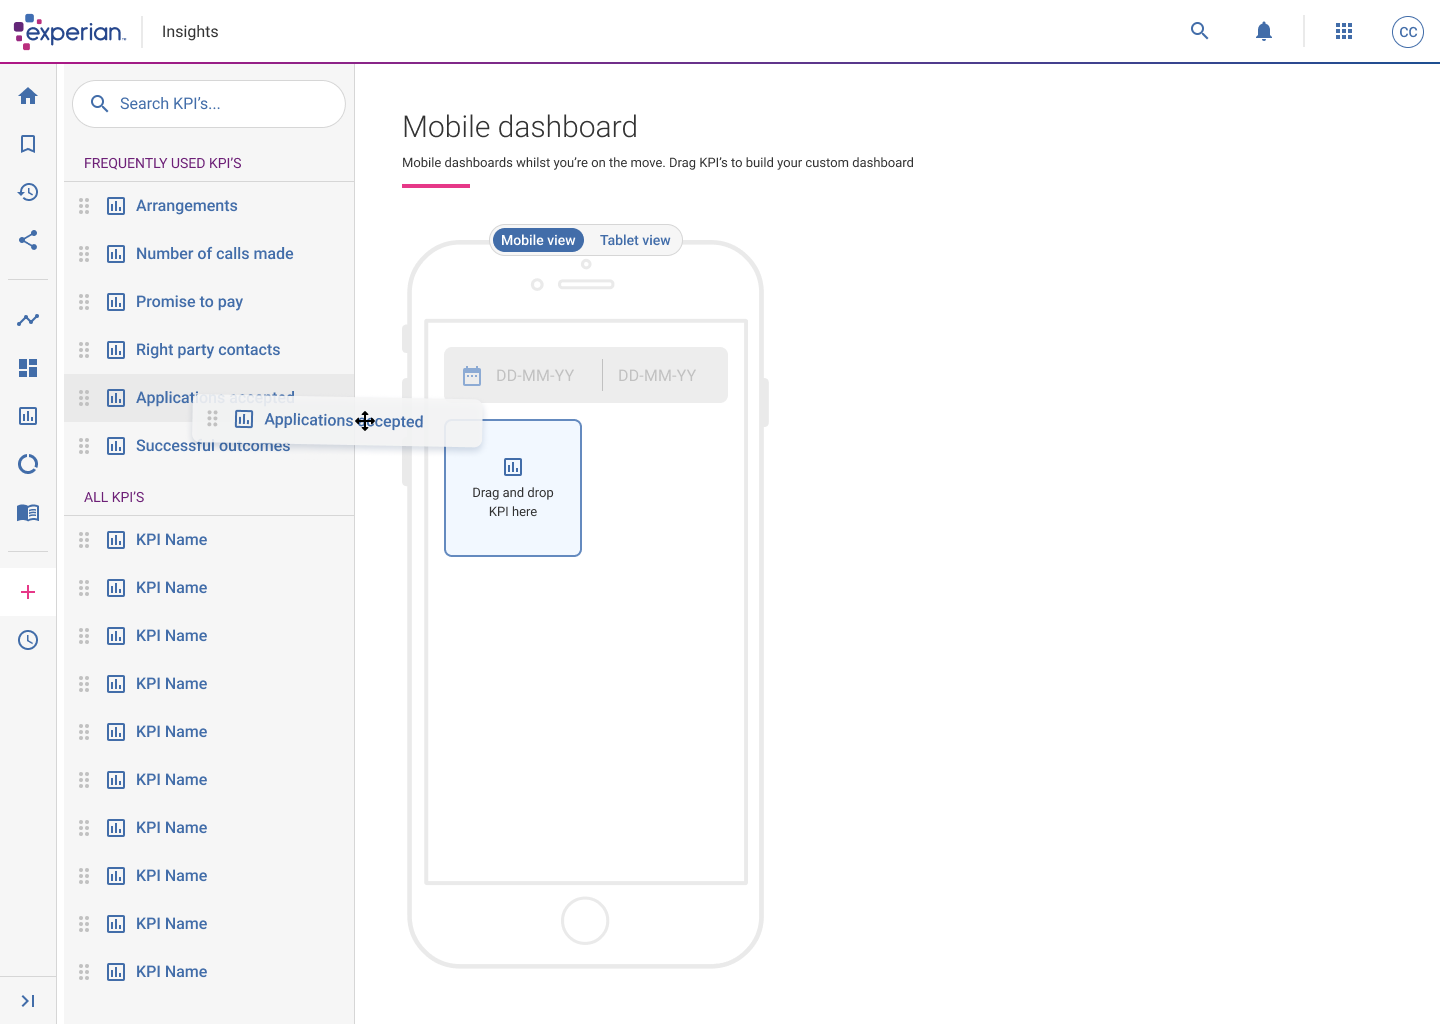
Taking inspiration from the Dashboard builder, I thought of creating something similar (for phase 1) but for a Mobile dashboard builder.
The idea of the Mobile dashboard builder was for managers and business owners to use this application to create their own personalised KPI dashboards so that they can look at real time stats and figures on the go from the comfort of their mobile phone or tablet.
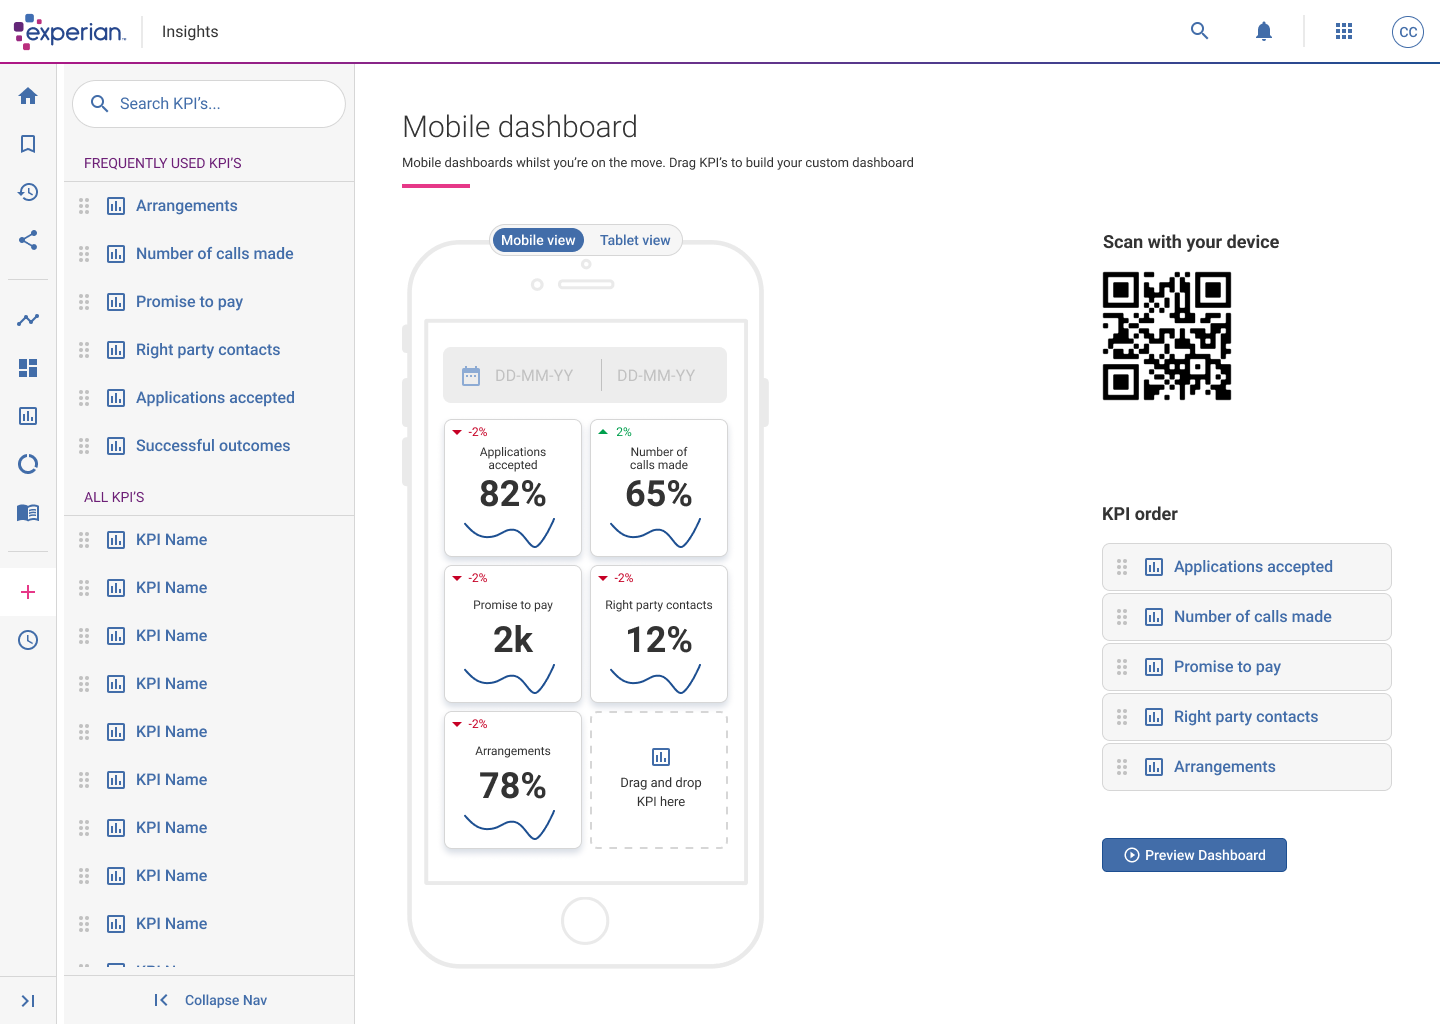
Users drag their KPIs onto the canvas, they can be reordered and adjusted however they wish.
For phase 2, the plan is to allow users to create these dashboards directly from their device.
LINKING TO MOBILE
Once users are happy with their dashboard they can scan the QR code with their device that they want to see the dashboard on.
Users get given a unique link assigned to their account and it will appear on their device to use.

