
user experience /
STERIS
COLLECT & DELIVER
the problem
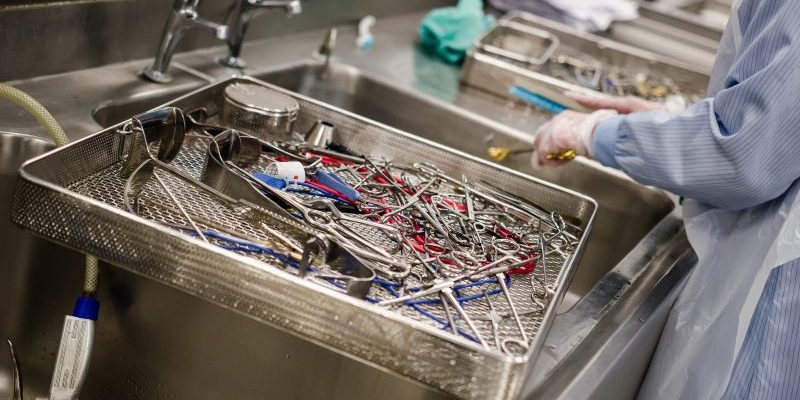
The plan for this project was to create a lean app-based solution to help porters in their daily job when collecting and delivering trolleys from a hospital facility to a cleaning warehouse, minimising any defects caused by human error in the process (roughly 80 defects per week!)
To do this, I looked at moving their current process of good ol’ pen and paper to a digital format. The porter would scan the clean trolleys they collected from the cleaning warehouse and drop them off at a hospital to be used, scanning their location on arrival, followed by any dirty trolleys they collected in that trip.
TEAM
1x Business analyst
2x Developers
My role
User research // User flows // Wireframes // Visual design // Prototyping // Testing
Exploration
The app aims to help delivery drivers perform their tasks with ease and efficiency, as well as cutting out any mistakes.
The current process involved drivers filling out sheets of paper with collection and delivery times, as well as writing down the number of trolleys they collected and where they had been collected or delivered from.
If there are any mistakes, a financial charge is added to the bill, this is in the hope that it will cut down mistakes going forward, but this is still happening.

Insights
Whilst shadowing a driver for the day, I learnt about the current processes in more detail, which highlighted a few issues that the drivers have on a day to day basis.
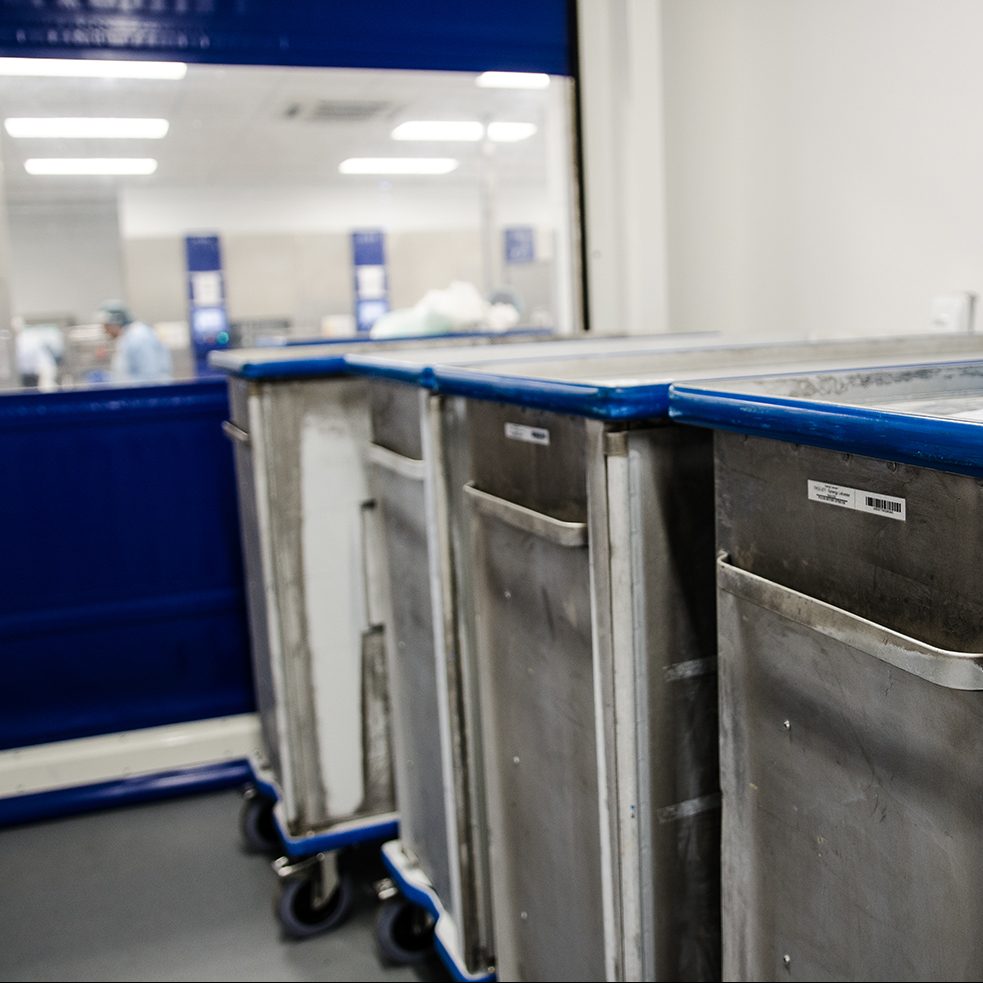
Trolleys getting mixed up
A trolley that is meant for one hospital may turn up at another. It sounds crazy, but these trolleys have poor wheels, cleaning staff tend to group trolleys together based on location ready for the porters to collect. Don’t be surprised if a trolley from one group slowly creeps away from the rest.
You only need a member of staff to notice a random trolley sitting in the corridor somewhere and they will put it back in the group where they thought it came from, but it’s actually the wrong one – et voila! Mixed up.
Fast-tracked trolleys
If the driver gets a call to come and collect a ‘Fast-tracked trolley’, they literally have to drop everything that they are currently doing to go collect that trolley ready for its emergency procedure. As a result of this, this is another way in that trolleys can easily get mixed up.
Completing delivery logs
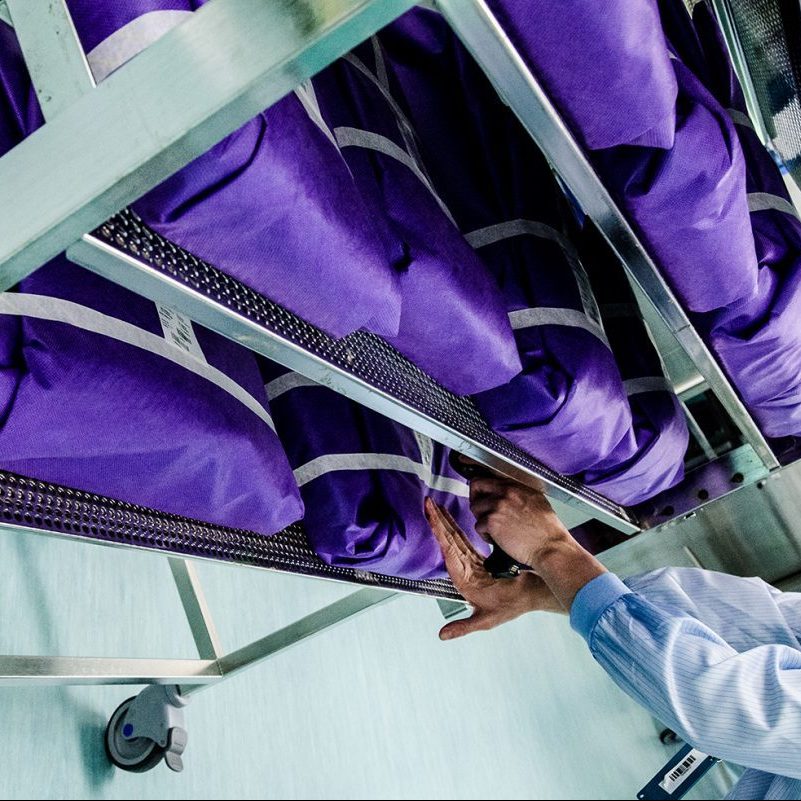
The porter will generally turn up to a hospital with a van of roughly 10+ trolleys ready to hand over. There is only one porter per van – so you would normally take 2 trolleys at a time (unless they’re really heavy). So that is 5+ trips from the van to the ward (which tends to be on the 6th floor somewhere) meaning elevator trips. This process can obviously take a long time after you’ve dropped the clean trolleys off and collected the dirty trolleys.
As well as this, the porters have to remember what they have dropped off, and what they have collected so they can fill in the delivery logs correctly – obviously, there are quite a few things that can go wrong with this, leading to quite a few discrepancies.

High level user journey

Product Features
Delivery drivers use a device called a Bluebird. It has a built-in scanner that allows drivers to scan their location where they are collecting trolleys from, as well as scan any trolleys that waiting for collection.
Once scanned, the app notified the facility the trolleys were collected, and they are getting delivered.
As well as notifying the facility, users could also view the location of the delivery van in transit due to the geolocation of the drivers phone device.
Lean UX process
Native Google Design
Geo-location tracking
Offline handling
Ideation Process
I created user flows – one happy path, and one that covered service drop out, the signal can be pretty poor in some hospitals so this needed to be carefully considered.
Happy path
After the user logs into their account, they land on the Tasks screen – this shows a personalised page relevant to the user and what tasks that they would perform on a day to day basis.
The ‘Collect’ feature, requires the user to scan the location they are collecting the trolleys from, then scan the trolleys waiting to be collected.
When scanned, the barcodes of the trolleys are checked against the database to see if it is recognised. If recognised, the trolley name and its ID gets logged to the collected list, and details are updated on the database accordingly.
If the barcode isn’t recognised, the user is then notified to take action to solve the problem. Users will be able to tell if the barcode isn’t recognised by the error noise the system makes (it’s loud!), as well as the Bluebird device vibrating in the user’s hand until the error has been acknowledged.
This process repeats until there are no more trolleys left to scan.
Unhappy path
The unhappy path covered how the app handled offline functionality.
The app talked to the database to make checks when scanning locations and trolleys, so it is vital to keep a signal.
Signal strength tends to be quite low in older facilities, so if the signal drops, the handling of this needed to be seamless, considering the importance of the trolley’s contents.
So when the user scans a trolley while the device is offline, the trolley details are stored in an ‘offline list’, and the current functionality handles the way it would normally. – making a ‘success’ noise to notify the user that a trolley has scanned.
When the signal returns – the database checks the ‘offline list’ for any trolley errors and duplications. If there are any, the app notifies the user to take action.

Wireframes
After taking all my research and findings into account, I started creating the wireframes in Balsamiq to work towards addressing the pain points the drivers currently have.
I mocked up some basic wireframes to help gather feedback from the drivers on the overall flow and layout whilst also considering the following:
Make the process as lean as possible to minimise completion time
Making visuals as intuitive and easy to understand as possible
Accommodating technophobes - I don't want to isolate older folk
Login & Password expiry
When the user opens the app, the first thing that they have to do is login with their credentials.
The app login had a 10minute inactivity period before it logged the user out of the app. If the user works for a longer time, the user can tap ‘Remember me’, and it will keep them signed in until they decide to log themselves out.
After logging in, the user is taken to their Task page, where they can set up, or do their daily jobs. – Phase 1, started with Collect and Deliver.


Collect
When the user opens the app, the first thing that they have to do is login with their credentials.
The app login had a 10minute inactivity period before it logged the user out of the app. If the user works for a longer time, the user can tap ‘Remember me’, and it will keep them signed in until they decide to log themselves out.
After logging in, the user is taken to their Task page, where they can set up, or do their daily jobs. – Phase 1, started with Collect and Deliver.


Hospital contacts
If something goes wrong during a journey, e.g. stuck in traffic, the driver can call the manager, or use the maps to navigate around and get to the location quickly.
Most drivers have roughly 3 or 4 delivery points that they drive to throughout their shift. Sometimes there can be ad-hoc requests for Fast Track deliveries that are needed urgently. These requests notify the user and take them directly to that location straight away.


Favourite tasks
The user can edit their favourites depending on what jobs they are doing throughout their shift. This updates the Task page when the user toggles each job on or off.


Notifications
The notifications page shows a timestamp of the driver’s journey throughout their shift.
So when a Driver arrives at a location, they need to scan their location barcode, as well as scan trolleys that are getting delivered and trolleys that they are collecting.


Flow chart
Creating a flow chart for the app gave me a high-level view of the whole process. Doing this helped me refine any little niggles with the expected behaviour and what pages users should navigate to when coming from specific pages.
User testing
I conducted a user test session with the drivers to see how they got on with the new design and whether they thought it improved the issues they were having previously during their shift.
I wrote a script including a scenario asking the user to login with their account details, select a task (in this case we were just focusing on ‘Collect’), scan their location, and a couple of trolleys.
I also managed to add the prototype onto the device so it gave the drivers the impression that it was the real thing.
During the session, I watched how they interacted with the device and started scanning the barcodes. Initially they were a little wary, but soon got the hang of it.
After they completed the scenario I asked what they thought of the process. Like all loved the simplicity of it but they all felt like they needed to go back to the van to fill the delivery logs in, but obviously the process cut out the need to do anything like that so they were really pleased with how much time it saved them.

The numbers
The aim was to reduce delivery defects by the drivers when collecting and delivering trolleys. The defect rate was quite high before the project kick off, and the issue was that trolleys weren’t obvious where they were getting delivered, and what the trolley content was. So facilities received trolleys they weren’t expecting.
Developing the app allowed drivers to scan the trolleys and their location; this reduced the defects significantly and increased overall productivity because hospitals were aware of when their delivery was expected. If there were an issue, the user would get notified by the app that there was a problem.
- Defect Rate (Without app) – 79%
- Defect Rate (With App) – 100%
- Productivity increased (With app) – 44%
CURRENT TROLLEYS PROCESSED A WEEk
TROLLEY DEFECTS A WEEK (WITHOUT APP)
TROLLEY DEFECTS A WEEK (WITH APP)
%